
Simply Maid research
Seasonal cleaning booking patterns
Which months and weekdays appear most often in Simply Maid’s fulfilled bookings? These historical patterns include the business’s changing coverage and capacity, so they cannot stand in for Australian demand.
A quick reference
Key findings
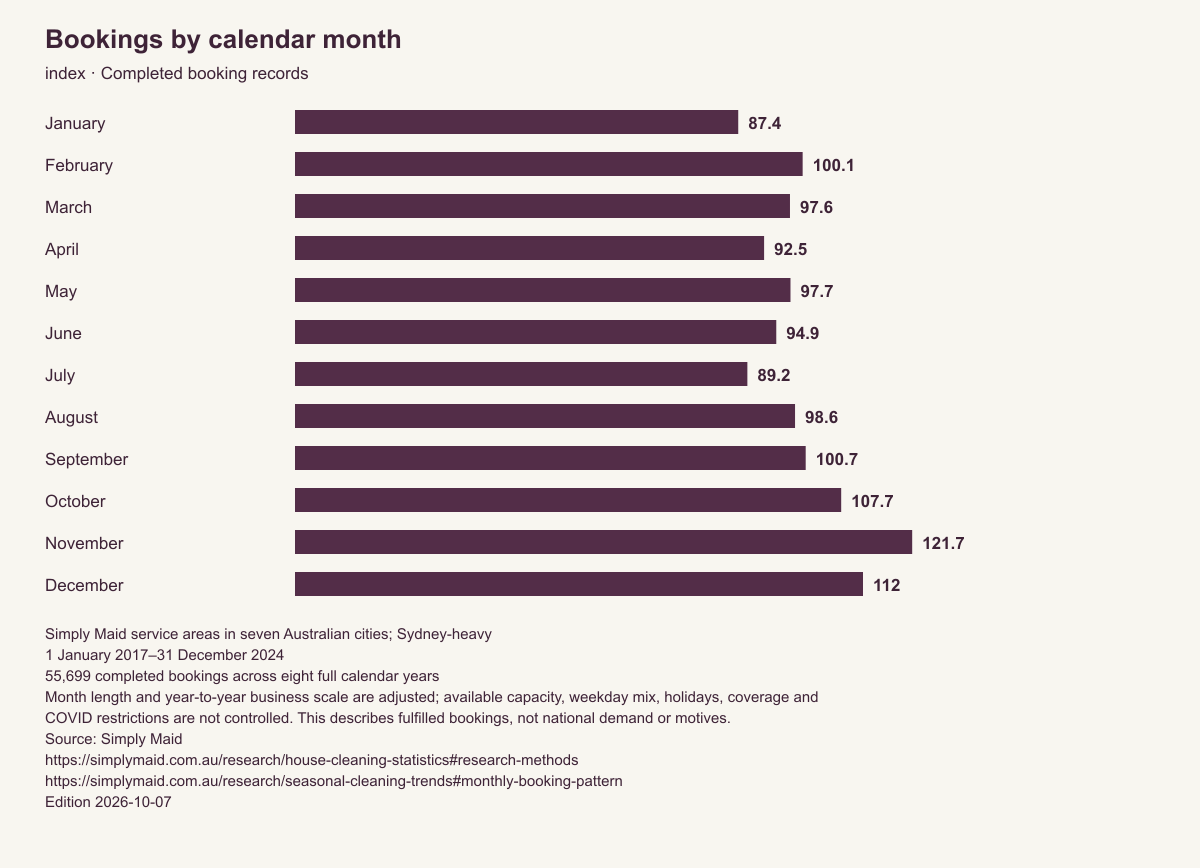
November’s Simply Maid booking rate averaged 121.7 on an index where each year’s daily rate equals 100, across 2017–2024 (55,699 completed bookings in seven Australian cities).
View supporting tableSimply Maid service areas in seven Australian cities; Sydney-heavy · 1 January 2017–31 December 2024. 55,699 completed bookings across eight full calendar years.
Month length and year-to-year business scale are adjusted; available capacity, weekday mix, holidays, coverage and COVID restrictions are not controlled. This describes fulfilled bookings, not national demand or motives.
Original source: Simply Maid — Matched Launch27 export and production booking records. Calculation and limitations.
The seasonal analysis compares bookings against calendar exposure across eight full years (2017–2024), rather than treating all months as the same length. Its denominator is 55,699 Simply Maid completed visits in seven Australian cities.
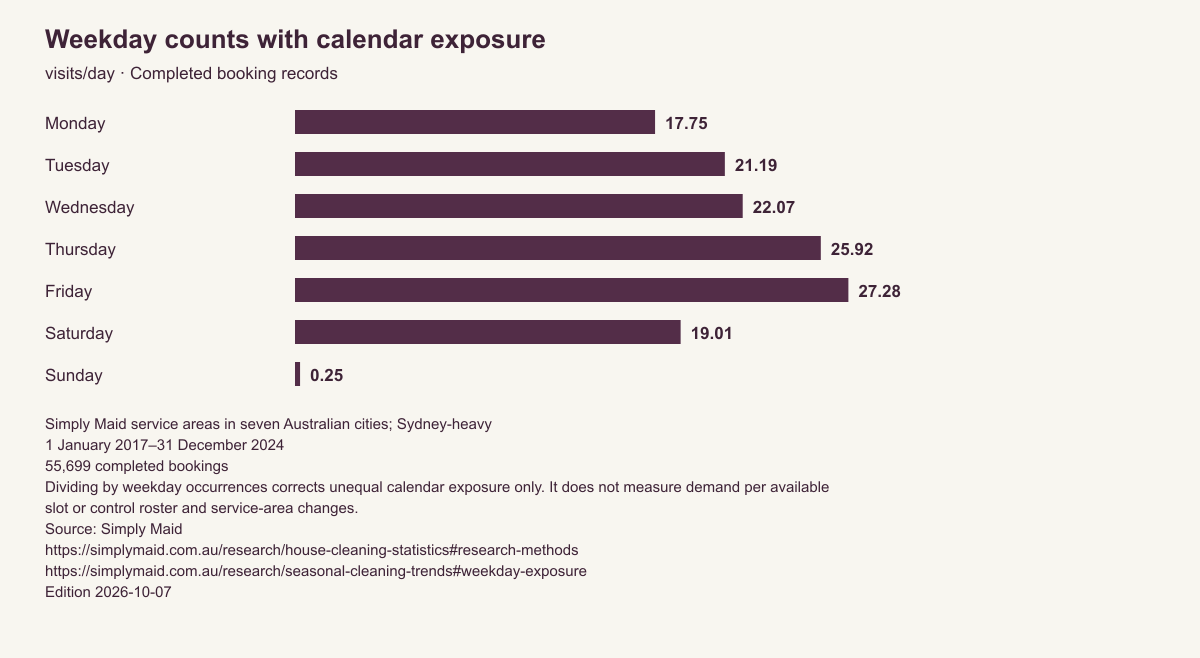
View supporting tableSimply Maid service areas in seven Australian cities; Sydney-heavy · 1 January 2017–31 December 2024. 55,699 completed bookings.
Dividing by weekday occurrences corrects unequal calendar exposure only. It does not measure demand per available slot or control roster and service-area changes.
Original source: Simply Maid — Matched Launch27 export and production booking records. Calculation and limitations.
Bookings by calendar month
| Month | Completed bookings (2017–2024) | Calendar days across eight years | Bookings per calendar day | Mean within-year daily-rate index (100 = annual rate) |
|---|---|---|---|---|
| January | 4,343 | 248 | 17.51 | 87.4 |
| February | 4,533 | 226 | 20.06 | 100.1 |
| March | 4,784 | 248 | 19.29 | 97.6 |
| April | 4,269 | 240 | 17.79 | 92.5 |
| May | 4,722 | 248 | 19.04 | 97.7 |
| June | 4,406 | 240 | 18.36 | 94.9 |
| July | 4,297 | 248 | 17.33 | 89.2 |
| August | 4,646 | 248 | 18.73 | 98.6 |
| September | 4,494 | 240 | 18.73 | 100.7 |
| October | 4,954 | 248 | 19.98 | 107.7 |
| November | 5,337 | 240 | 22.24 | 121.7 |
| December | 4,914 | 248 | 19.81 | 112 |
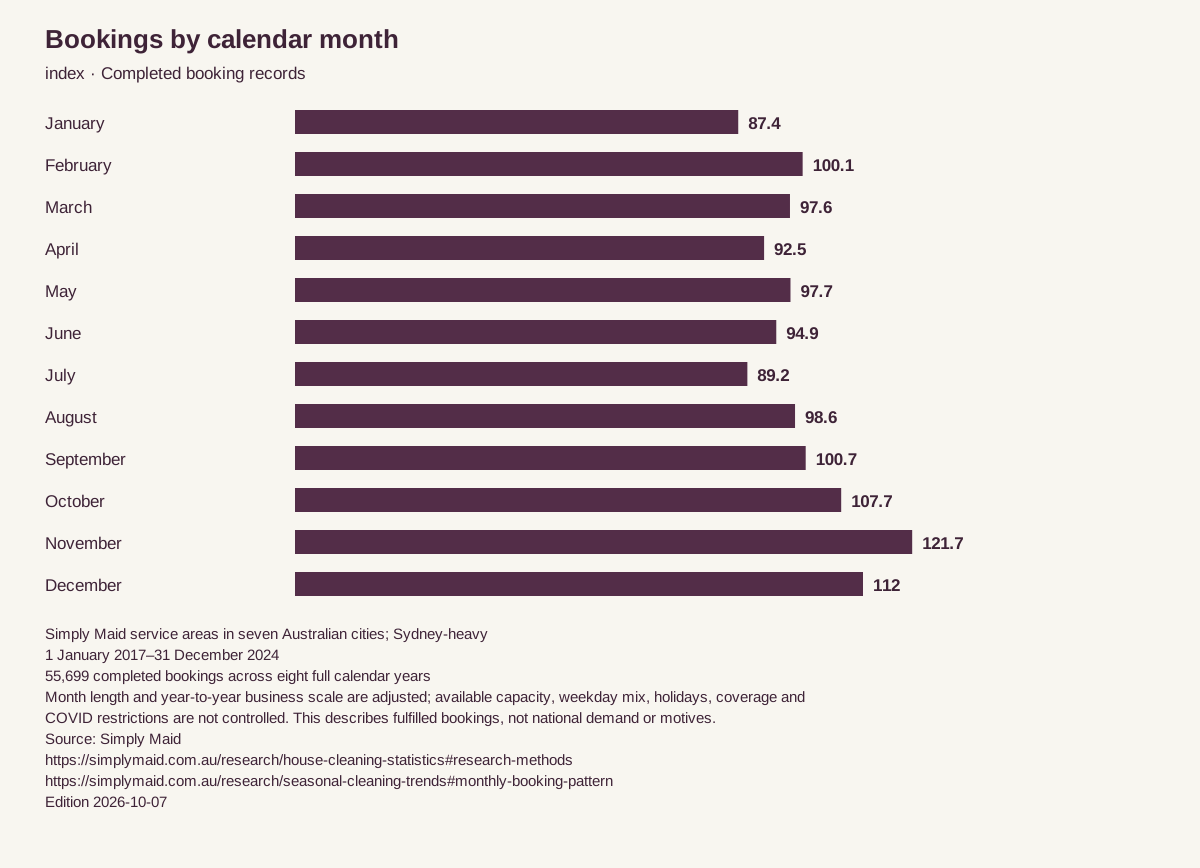
Simply Maid service areas in seven Australian cities; Sydney-heavy · 1 January 2017–31 December 2024. 55,699 completed bookings across eight full calendar years.
Month length and year-to-year business scale are adjusted; available capacity, weekday mix, holidays, coverage and COVID restrictions are not controlled. This describes fulfilled bookings, not national demand or motives.
Original source: Simply Maid — Matched Launch27 export and production booking records. Calculation and limitations.
How this table was made
- Calculation
- For each year, divide each month’s bookings by its calendar days, then divide by that year’s bookings per calendar day and multiply by 100. Average the eight annual indices with equal year weights. Also show pooled counts and calendar-day exposure.
- Unit and denominator
- Completed booking records. 55,699 completed bookings across eight full calendar years
- Missing fields
- No missing legacy IDs, customer account IDs or service dates in the matched cohort.
- Weighting
- Each of 2017–2024 has equal weight in the index; raw counts are pooled.
- Exclusions
- Pre-window years 2015–2016 and partial 2025 are outside this analysis window. The later platform gap is not treated as zero demand.
- Disclosure threshold
- At least 30 visits and 20 distinct customer accounts in each published historical cell; no booking-level or postcode exports.
- Data cutoff
- Historical platform through 23 September 2025; production reconciliation captured 7 October 2026
- Edition
- 2026-10-07
Weekday counts with calendar exposure
| Weekday | Completed bookings (2017–2024) | Occurrences in period | Bookings per calendar occurrence |
|---|---|---|---|
| Monday | 7,420 | 418 | 17.75 |
| Tuesday | 8,859 | 418 | 21.19 |
| Wednesday | 9,203 | 417 | 22.07 |
| Thursday | 10,808 | 417 | 25.92 |
| Friday | 11,376 | 417 | 27.28 |
| Saturday | 7,929 | 417 | 19.01 |
| Sunday | 104 | 418 | 0.25 |
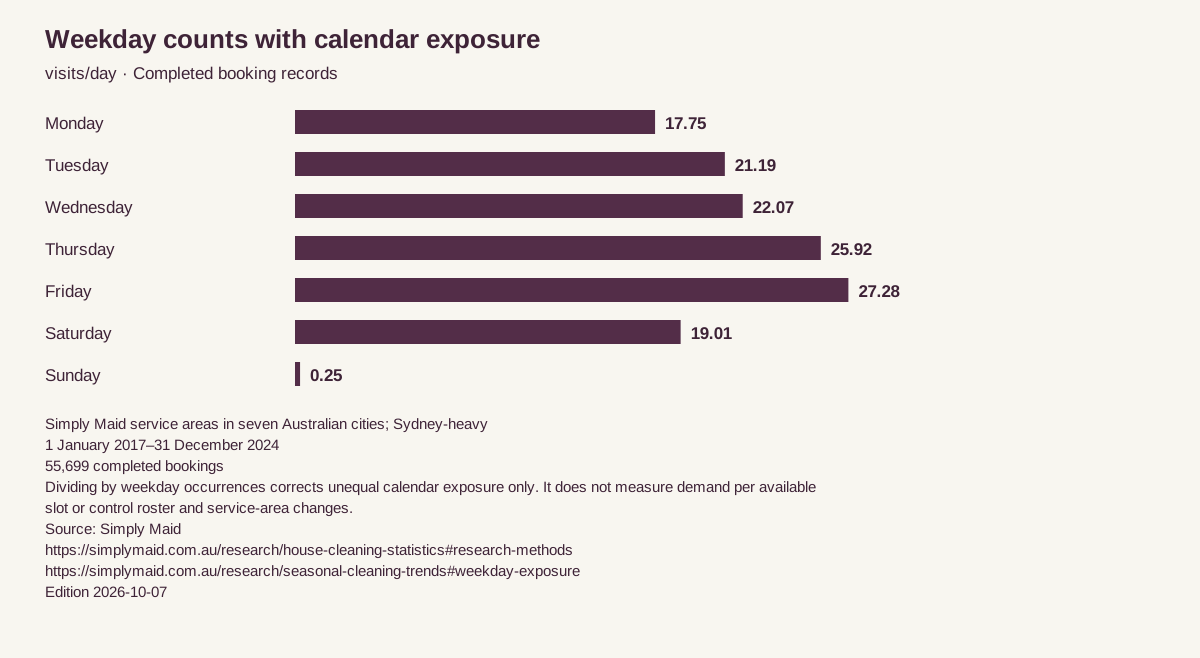
Simply Maid service areas in seven Australian cities; Sydney-heavy · 1 January 2017–31 December 2024. 55,699 completed bookings.
Dividing by weekday occurrences corrects unequal calendar exposure only. It does not measure demand per available slot or control roster and service-area changes.
Original source: Simply Maid — Matched Launch27 export and production booking records. Calculation and limitations.
How this table was made
- Calculation
- Count each weekday in the calendar window, including leap days; divide pooled visits on that weekday by its number of calendar occurrences. Calendar occurrence is not an available service slot.
- Unit and denominator
- Completed booking records. 55,699 completed bookings
- Missing fields
- No missing legacy IDs, customer account IDs or service dates in the matched cohort.
- Weighting
- Unweighted records; frequent customers contribute more visits.
- Exclusions
- Only 2017–2024; partial historical years and the later platform gap excluded.
- Disclosure threshold
- At least 30 visits and 20 distinct customer accounts in each published historical cell; no booking-level or postcode exports.
- Data cutoff
- Historical platform through 23 September 2025; production reconciliation captured 7 October 2026
- Edition
- 2026-10-07
How to read the monthly index
An index of 100 means a month’s daily booking rate equals that year’s daily average. Each year contributes equally to the final index, so a high-volume year does not dominate just because the business was larger. Raw counts and calendar-day exposure remain visible for checking the calculation.
November’s 121.7 means the average within-year rate was about 21.7% above its annual daily rate. September’s 100.7 is close to that baseline. This is a different calculation from the original article’s pooled equal-month index; a changed number does not mean the underlying bookings have changed.
Full calendar years avoid weighting a year with only a few months of records as though it were complete. The 2017–2024 window includes COVID restrictions and changes in service coverage. Those influences remain in the data. The 2025–2026 platform gap is outside this window rather than counted as a period of zero demand.
What calendar adjustment cannot tell us
Calendar days are exposure, not available booking slots. A month can have more of the weekdays the business tends to fulfil, and Sunday availability differs from Friday availability. The separate weekday table corrects counts for occurrences but does not remove the weekday mix from the monthly index.
We do not have a consistent historical capacity series, so this analysis cannot measure bookings per available cleaner-hour, unmet demand or customer preference. Holidays, roster changes, growth within a year, marketing, geography and service mix can all affect the totals. We do not claim spring cleaning is a myth or infer Christmas preparation from service dates.
A future model could compare the same service areas and services with actual available slots and public-holiday calendars. Until those inputs are verified, that is a research proposal rather than an adjusted result.
Methods, scope and responsibility
This edition counts 56,712 records marked completed in the historical Simply Maid platform, dated 5 August 2015–23 September 2025. These are repeated visits across seven service cities, concentrated in Sydney. They are not a sample of Australian households. 9,241 distinct customer accounts appear; accounts are not independently identified households or homes.
We matched the original Launch27 export to production using Booking ID / legacyBookingId. The export has 56,782 rows; 70 absent from production were excluded. Ascending and descending production scans overlapped by 5,030 rows. We deduplicated by production record ID and checked unique legacy IDs. Customer and calendar grouping have no missing keys in this cohort. Only aggregates are published.
Calendar analysis reads the original local service date (DD/MM/YYYY). It does not apply a UTC offset to that date or equate scheduled starts with recorded arrivals. Historical records do not provide trustworthy measured cleaner time. We publish no duration result from them.
Booking-count tables retain 380 zero-charge visits; they are records marked completed, not verified paid cleans. Refunds do not establish whether a visit took place and are not an exclusion in these historical count tables. No imports have the staff-test flag; an absence of a flag cannot independently rule out all unflagged tests. Each historical result cell must contain at least 30 visits and 20 distinct customer accounts. No address, customer, cleaner, holiday-day or postcode-level result is exported.
The historical and native platforms remain separate. We found no shared legacy booking IDs across them; this does not establish identity for every person using both systems. Pricing’s 56,546 at its 7 October 2026 cutoff equals 56,712 historical records minus 380 zero-charge historical records plus 214 eligible native-platform visits. Pricing additionally filters staff tests, staff customers, future dates, missing service/city data and refunds of at least 90%. It is a different, changing denominator, not a correction of the historical headline.
Historical coverage is sparse after May 2025 and has a late September record; the native-platform cohort starts in April 2026. A gap in these records is not evidence of zero Australian cleaning demand. We do not join the gap into a continuous demand or price trend.
Data owner: Simply Maid. This edition is an AI-assisted editorial reanalysis of company service records. The original report was credited to Huy Hoang, founder; no independent statistical review or new personal reviewer sign-off is asserted. Questions and corrections can use the existing media contact.
Historical data through: 23 September 2025. Production reconciliation and sources checked: 7 October 2026. Edition and article update: 7 October 2026. The initial pillar publication date remains 1 September 2026. Each table has its own calculation, denominator and exclusions. Download the frozen edition.
Corrections
7 October 2026: replaced pooled equal-month comparisons with calendar-day exposure and equal-year indices for 2017–2024. Removed unsupported motive and national-demand claims. Earlier pillar corrections remain available.