
Simply Maid research
Australian House Cleaning Statistics
A decade of Simply Maid booking records, with separately sourced Australian household research. The Great Australian Clean is now part of this research series. Our bookings describe our customers and operations; national survey findings use their own populations and definitions.
A quick reference
Key findings
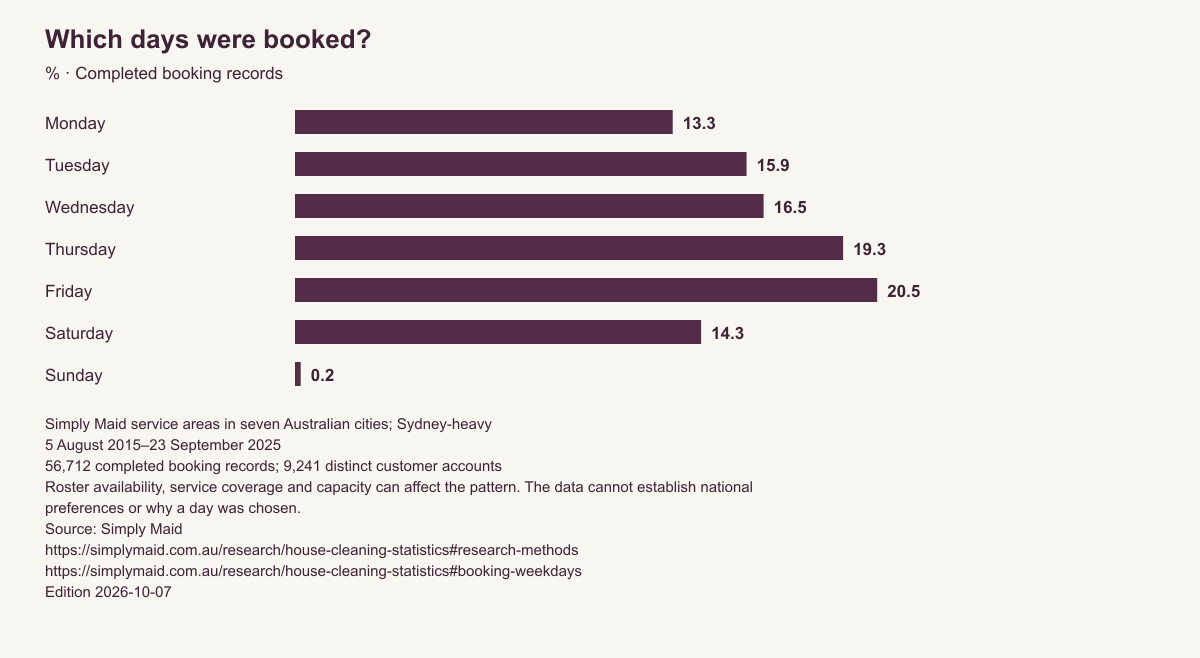
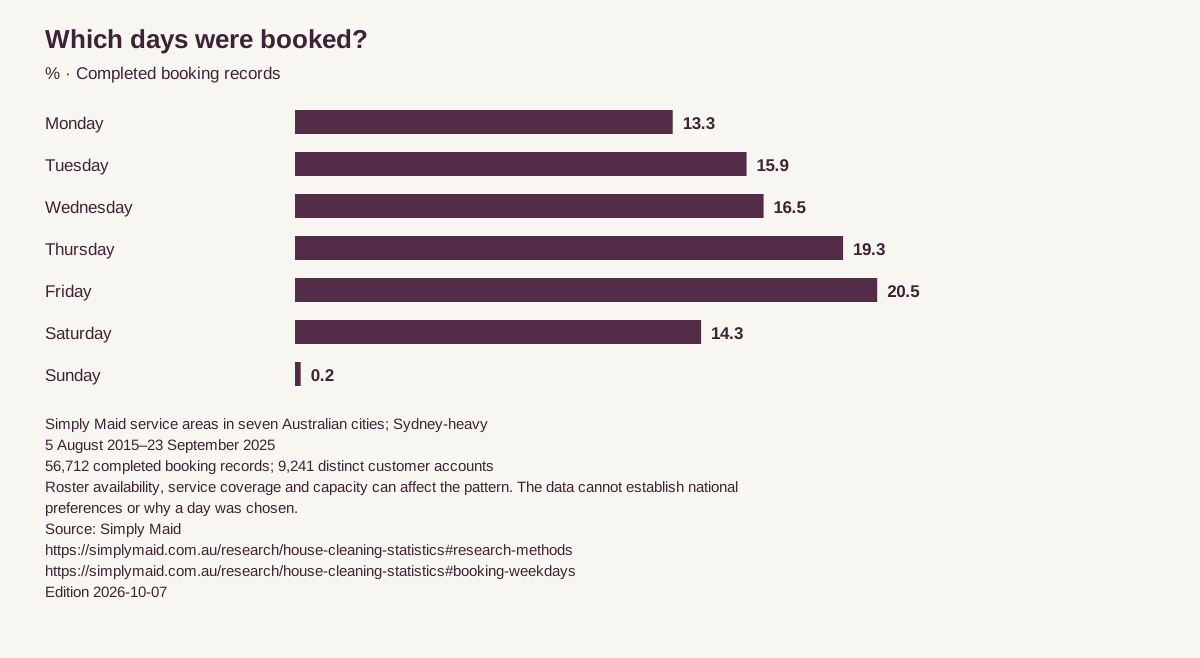
Friday accounted for 20.5% of Simply Maid’s 56,712 historical completed booking records across seven Australian cities, 5 August 2015–23 September 2025.
View supporting tableSimply Maid service areas in seven Australian cities; Sydney-heavy · 5 August 2015–23 September 2025. 56,712 completed booking records; 9,241 distinct customer accounts.
Roster availability, service coverage and capacity can affect the pattern. The data cannot establish national preferences or why a day was chosen.
Original source: Simply Maid — Matched Launch27 export and production booking records. Calculation and limitations.
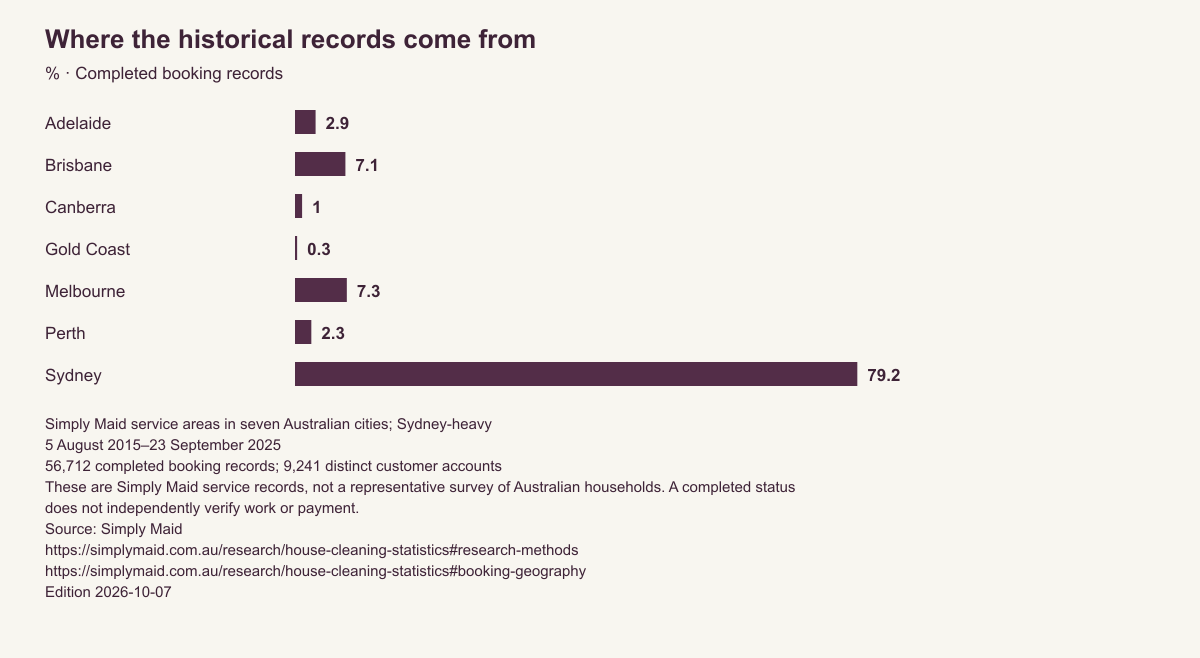
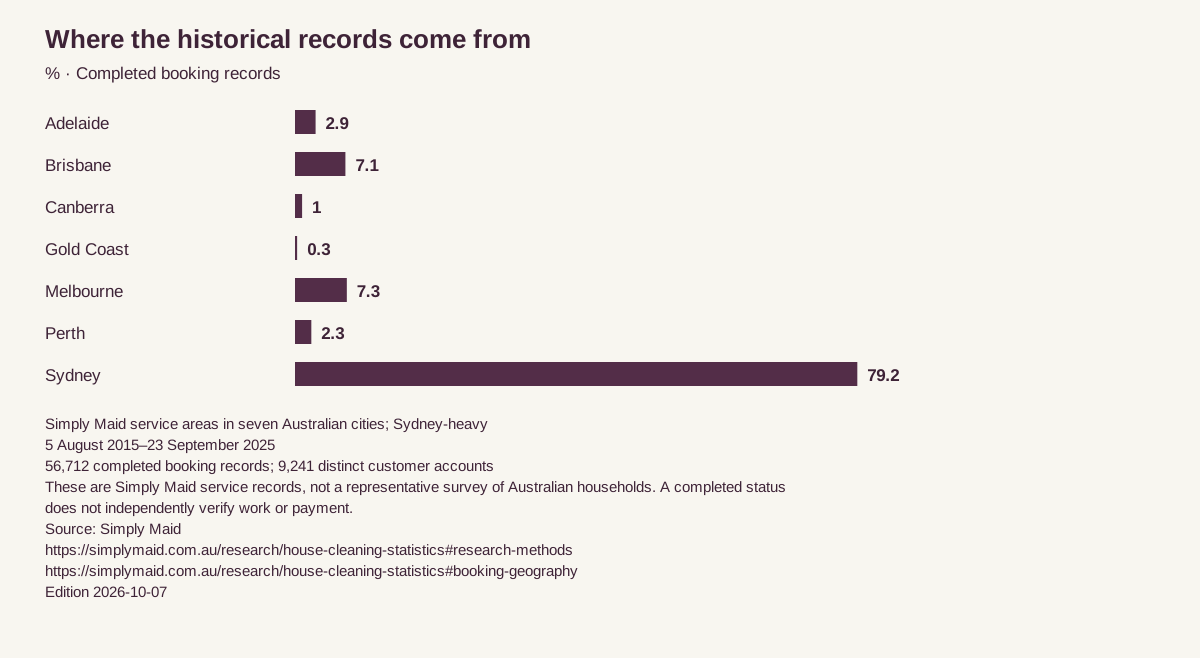
Sydney accounts for 79.2% of the 56,712 Simply Maid historical completed bookings (5 August 2015–23 September 2025); the sample is geographically concentrated.
View supporting tableSimply Maid service areas in seven Australian cities; Sydney-heavy · 5 August 2015–23 September 2025. 56,712 completed booking records; 9,241 distinct customer accounts.
These are Simply Maid service records, not a representative survey of Australian households. A completed status does not independently verify work or payment.
Original source: Simply Maid — Matched Launch27 export and production booking records. Calculation and limitations.
The historical Simply Maid study counts 56,712 completed visits, not 56,712 households: its 9,241 customer accounts may each contribute multiple bookings (5 August 2015–23 September 2025).
View supporting tableSimply Maid service areas in seven Australian cities; Sydney-heavy · 5 August 2015–23 September 2025. 56,712 completed booking records; 9,241 distinct customer accounts.
Service families use the historical importer’s classification. Move-in and move-out are combined; hourly includes re-cleans. A customer account is not necessarily one household or home.
Original source: Simply Maid — Matched Launch27 export and production booking records. Calculation and limitations.
Which days were booked?
| Scheduled weekday | Completed bookings | Share of bookings (%) |
|---|---|---|
| Monday | 7,536 | 13.3 |
| Tuesday | 9,031 | 15.9 |
| Wednesday | 9,349 | 16.5 |
| Thursday | 10,972 | 19.3 |
| Friday | 11,606 | 20.5 |
| Saturday | 8,103 | 14.3 |
| Sunday | 115 | 0.2 |
Simply Maid service areas in seven Australian cities; Sydney-heavy · 5 August 2015–23 September 2025. 56,712 completed booking records; 9,241 distinct customer accounts.
Roster availability, service coverage and capacity can affect the pattern. The data cannot establish national preferences or why a day was chosen.
Original source: Simply Maid — Matched Launch27 export and production booking records. Calculation and limitations.
How this table was made
- Calculation
- Read the original DD/MM/YYYY local service date, then group its calendar weekday without applying a timezone offset. Dates describe scheduled service days, not measured arrivals.
- Unit and denominator
- Completed booking records. 56,712 completed booking records; 9,241 distinct customer accounts
- Missing fields
- No missing legacy IDs, customer account IDs or service dates in the matched cohort.
- Weighting
- Unweighted records; frequent customers contribute more visits.
- Exclusions
- 70 export rows absent from production; cancelled or uncompleted records and flagged staff tests excluded. The historical cohort contains no flagged staff tests. Zero-charge records retained for booking counts; refunds are not used to infer whether a visit occurred. Unflagged tests cannot be independently ruled out.
- Disclosure threshold
- At least 30 visits and 20 distinct customer accounts in each published historical cell; no booking-level or postcode exports.
- Data cutoff
- Historical platform through 23 September 2025; production reconciliation captured 7 October 2026
- Edition
- 2026-10-07
Where the historical records come from
| City | Completed bookings | Share of bookings (%) |
|---|---|---|
| Adelaide | 1,645 | 2.9 |
| Brisbane | 4,005 | 7.1 |
| Canberra | 557 | 1 |
| Gold Coast | 167 | 0.3 |
| Melbourne | 4,126 | 7.3 |
| Perth | 1,294 | 2.3 |
| Sydney | 44,918 | 79.2 |
Simply Maid service areas in seven Australian cities; Sydney-heavy · 5 August 2015–23 September 2025. 56,712 completed booking records; 9,241 distinct customer accounts.
These are Simply Maid service records, not a representative survey of Australian households. A completed status does not independently verify work or payment.
Original source: Simply Maid — Matched Launch27 export and production booking records. Calculation and limitations.
How this table was made
- Calculation
- Match export Booking ID to production legacyBookingId; deduplicate scans on _id and verify unique legacy IDs. Count records marked completed. Divide each count by the stated denominator.
- Unit and denominator
- Completed booking records. 56,712 completed booking records; 9,241 distinct customer accounts
- Missing fields
- No missing legacy IDs, customer account IDs or service dates in the matched cohort.
- Weighting
- Unweighted records; frequent customers contribute more visits.
- Exclusions
- 70 export rows absent from production; cancelled or uncompleted records and flagged staff tests excluded. The historical cohort contains no flagged staff tests. Zero-charge records retained for booking counts; refunds are not used to infer whether a visit occurred. Unflagged tests cannot be independently ruled out.
- Disclosure threshold
- At least 30 visits and 20 distinct customer accounts in each published historical cell; no booking-level or postcode exports.
- Data cutoff
- Historical platform through 23 September 2025; production reconciliation captured 7 October 2026
- Edition
- 2026-10-07
What services were recorded?
| Recorded service family | Completed bookings | Share of bookings (%) |
|---|---|---|
| Deep / initial | 5,362 | 9.5 |
| Hourly / re-clean | 7,379 | 13 |
| Move-in / move-out (combined) | 1,716 | 3 |
| Standard | 42,255 | 74.5 |
Simply Maid service areas in seven Australian cities; Sydney-heavy · 5 August 2015–23 September 2025. 56,712 completed booking records; 9,241 distinct customer accounts.
Service families use the historical importer’s classification. Move-in and move-out are combined; hourly includes re-cleans. A customer account is not necessarily one household or home.
Original source: Simply Maid — Matched Launch27 export and production booking records. Calculation and limitations.
How this table was made
- Calculation
- Match export Booking ID to production legacyBookingId; deduplicate scans on _id and verify unique legacy IDs. Count records marked completed. Divide each count by the stated denominator.
- Unit and denominator
- Completed booking records. 56,712 completed booking records; 9,241 distinct customer accounts
- Missing fields
- No missing legacy IDs, customer account IDs or service dates in the matched cohort.
- Weighting
- Unweighted records; frequent customers contribute more visits.
- Exclusions
- 70 export rows absent from production; cancelled or uncompleted records and flagged staff tests excluded. The historical cohort contains no flagged staff tests. Zero-charge records retained for booking counts; refunds are not used to infer whether a visit occurred. Unflagged tests cannot be independently ruled out.
- Disclosure threshold
- At least 30 visits and 20 distinct customer accounts in each published historical cell; no booking-level or postcode exports.
- Data cutoff
- Historical platform through 23 September 2025; production reconciliation captured 7 October 2026
- Edition
- 2026-10-07
How often were cleaners booked?
Original frequency labels show that 46.7% of completed historical visits were fortnightly. The customer-level picture is different: 69.6% of accounts’ first observed completed bookings were one-off. A weekly customer can contribute many more visits than a one-off customer. See the frequency table and correction. These observations do not measure DIY cleaning habits.
For choosing a schedule for your own home, use how often to hire a cleaner.
When did bookings take place?
November remains higher than an average month after adjusting for month length and annual business scale in 2017–2024. That is a pattern in fulfilled Simply Maid bookings, not evidence that spring cleaning is a myth or that customers were preparing for Christmas. Compare the calendar-adjusted tables.
Australian household research: a different evidence base
The ABS 2024 Time Use Survey separates whether a person did housework on a diary day from time spent by those who participated. Among participants, its published housework averages are 1.5 hours for males and 1.8 for females aged 15+. Those are decimal hours, not the duration of a professional clean. Read the definitions and comparison.
Finder’s March 2025 release reports that 15% of 1,029 respondents paid someone outside their family for cleaning in the previous 12 months. Its table says February 2025 fieldwork, but the methodology says February 2024. Until that inconsistency is resolved, this is an attributed report of Finder’s result, not a confirmed 2025 fieldwork estimate. It does not measure households, current subscriptions or 2026 adoption. Read Finder’s original question and methodology.
What these records cannot say about prices or labour
Mixed historical bills reflect different home sizes, service types, extras and discounts. A city’s lower average bill cannot establish that it was the cheapest market, and a mixed average-bill change is not cleaning inflation. These comparisons are withdrawn pending comparable-cohort analysis. Current cleaning prices remain separate from this historical research.
Historical booked duration does not establish elapsed time on site or summed cleaner-hours. A measured duration study would require reliable check-ins, check-outs and team membership. We do not restore the earlier 101-minute claim.
Explore the supporting studies
Follow the related studies, source data and practical guidance below.
Housework time in Australia
ABS 2024 population estimates: participation, participant time and how to read their different denominators. Published 7 October 2026.
Cleaning frequency: visits and customers
Original Simply Maid analysis: booked frequency versus each customer account’s first observed completed booking, 2015–2025. Published 7 October 2026.
Seasonal cleaning booking patterns
Original Simply Maid analysis: calendar exposure and equal-year monthly comparisons, 2017–2024. Published 7 October 2026.
Download and verify this edition
Follow the related studies, source data and practical guidance below.
Complete frozen data edition
Version, definitions, qualifications and all eight aggregate tables. Individual CSVs and chart downloads are beside each table.
Booking weekdays chart (PNG)
Includes scope, observation period, denominator and source.
Booking weekdays table (CSV)
The same seven rows shown on this page, with metadata repeated per row.
For journalists and publishers
You may reuse Simply Maid’s published aggregate figures and supplied charts with visible attribution. Keep the period and limitations. External research remains credited to its original owner and subject to that source’s reuse terms.
Key findings
Self-contained findings with source-preserving copy controls.
Charts, tables and data
Ungated PNG, SVG and aggregate CSV files.
Methods and corrections
Scope, calculations, exclusions and the preserved correction history.
Suggested citation
Copy a finding or table with its exact source section and data edition.
Media enquiries
Existing media contact details and company information.
About the original author
Huy Hoang, Simply Maid founder. No independent research review is claimed.
Suggested citation
Simply Maid. Australian House Cleaning Statistics (The Great Australian Clean), edition 7 October 2026. Historical booking records: 5 August 2015–23 September 2025. Canonical research page. Use the copy controls beside a finding or table to retain its exact section, denominator and qualification.
Methods, scope and responsibility
This edition counts 56,712 records marked completed in the historical Simply Maid platform, dated 5 August 2015–23 September 2025. These are repeated visits across seven service cities, concentrated in Sydney. They are not a sample of Australian households. 9,241 distinct customer accounts appear; accounts are not independently identified households or homes.
We matched the original Launch27 export to production using Booking ID / legacyBookingId. The export has 56,782 rows; 70 absent from production were excluded. Ascending and descending production scans overlapped by 5,030 rows. We deduplicated by production record ID and checked unique legacy IDs. Customer and calendar grouping have no missing keys in this cohort. Only aggregates are published.
Calendar analysis reads the original local service date (DD/MM/YYYY). It does not apply a UTC offset to that date or equate scheduled starts with recorded arrivals. Historical records do not provide trustworthy measured cleaner time. We publish no duration result from them.
Booking-count tables retain 380 zero-charge visits; they are records marked completed, not verified paid cleans. Refunds do not establish whether a visit took place and are not an exclusion in these historical count tables. No imports have the staff-test flag; an absence of a flag cannot independently rule out all unflagged tests. Each historical result cell must contain at least 30 visits and 20 distinct customer accounts. No address, customer, cleaner, holiday-day or postcode-level result is exported.
The historical and native platforms remain separate. We found no shared legacy booking IDs across them; this does not establish identity for every person using both systems. Pricing’s 56,546 at its 7 October 2026 cutoff equals 56,712 historical records minus 380 zero-charge historical records plus 214 eligible native-platform visits. Pricing additionally filters staff tests, staff customers, future dates, missing service/city data and refunds of at least 90%. It is a different, changing denominator, not a correction of the historical headline.
Historical coverage is sparse after May 2025 and has a late September record; the native-platform cohort starts in April 2026. A gap in these records is not evidence of zero Australian cleaning demand. We do not join the gap into a continuous demand or price trend.
Data owner: Simply Maid. This edition is an AI-assisted editorial reanalysis of company service records. The original report was credited to Huy Hoang, founder; no independent statistical review or new personal reviewer sign-off is asserted. Questions and corrections can use the existing media contact.
Historical data through: 23 September 2025. Production reconciliation and sources checked: 7 October 2026. Edition and article update: 7 October 2026. The initial pillar publication date remains 1 September 2026. Each table has its own calculation, denominator and exclusions. Download the frozen edition.
Source register
Simply Maid: production booking records and matched original Launch27 export; read-only reconciliation on 7 October 2026. Source-file checksum and aggregate reconciliation are preserved with this edition. The table methods identify whether a result counts visits or customer accounts.
ABS: How Australians use their time, 2024 and 2024 methodology, checked 7 October 2026. The observation year is 2024, not 2026.
Finder: Hired help, published 25 March 2025, checked 7 October 2026. Its table states February 2025 fieldwork; its methodology says February 2024. This unresolved discrepancy accompanies the finding. We do not use its extrapolated national spending totals.
Historical reference retained for the correction log: ABS Consumer Price Index, June quarter 2024, All groups series A2325846C. We no longer interpret mixed average Simply Maid bills as a comparable price index.
Corrections and publication history
7 October 2026: moved the report to /research/house-cleaning-statistics. Removed national preference claims, inferred Christmas motives, the city-cost ranking and its competition explanation, and the mixed-bill/CPI ‘real-terms cheaper’ conclusion. Retained earlier corrections below as a historical log, not current endorsements of their conclusions.
The count of 56,712 historical completed records reproduces. ‘About 9,240 households’ is replaced by 9,241 distinct customer accounts. Original export frequency labels differ from imported originalFrequencyText on 6,502 matched rows, principally hourly services whose labels were reset to One Time. Using original export labels yields 46.7% fortnightly visits, and 81.3% visits with a recurring label. The former 42%, 69.8% and 3.5-to-1 descriptions are withdrawn. The 14 ‘Every week’ labels also need weekly classification rather than one-off.
Seasonality now uses full calendar years 2017–2024, calendar-day rates and equal weights for annual indices. This changes the index and is not a newly observed change in behaviour. Low-count holiday and individual loyalty examples are removed from reuse exports. Historical scheduled duration is still not measured time on site.
- 20 September 2026: every figure was re-computed from the production booking database. Most reproduced. The corrections: the day-of-week table had been computed with a time-zone offset that shifted afternoon cleans onto the next day, which overstated Sunday (now 0.2%, not 2%) and understated Monday and Thursday; the Christmas Day count is four cleans, not 21; Mosman was the busiest postcode for four years (2016–2019), not five; the decade-wide average price is about $185, not $195 ($195 is Sydney's recent average); the "single busiest day" claim could not be reproduced and was removed; and the average duration of 101 minutes and the 95,772-hours total were removed because the historical records contain no reliable duration. Financial-year and city averages were updated to the re-computed values (differences of $1–4).
- 22 September 2026: the CPI comparison now uses the same five financial years as the price series (ABS financial-year averages, about 20%) instead of a June-2018-to-June-2024 figure (22.8%) that covered six years; the real-terms conclusion is unchanged. A duplicated fragment in the quick answer was removed, and several headings that said "Australia" now say what the data can support: our own customers. A second read-only reproduction from the production table the same day adjusted five details: about 9,240 households (not 9,260); July joins April and January among the quietest months; Mosman led for three years (2017–2019), not four, and Marrickville first reached the top ten in 2024; the 9am figure is the 9am hour (9:00 sharp alone is 17.7%); 1,345 and 207 in the loyalty tail (not 1,346 and 208); and the records do carry a booked duration (about 100 minutes on average), just not the time actually spent on site.