
Simply Maid research
Cleaning frequency: visits and customers
A visit-weighted percentage can look very different from a customer-weighted percentage. We compare both using the same matched historical records, without claiming to measure Australian DIY habits.
A quick reference
Key findings
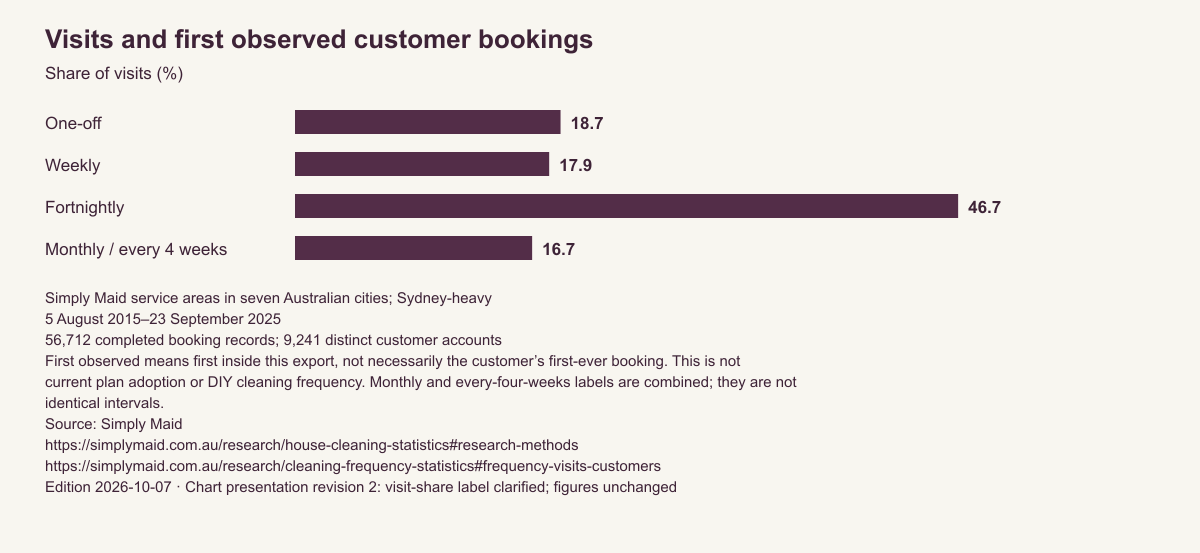
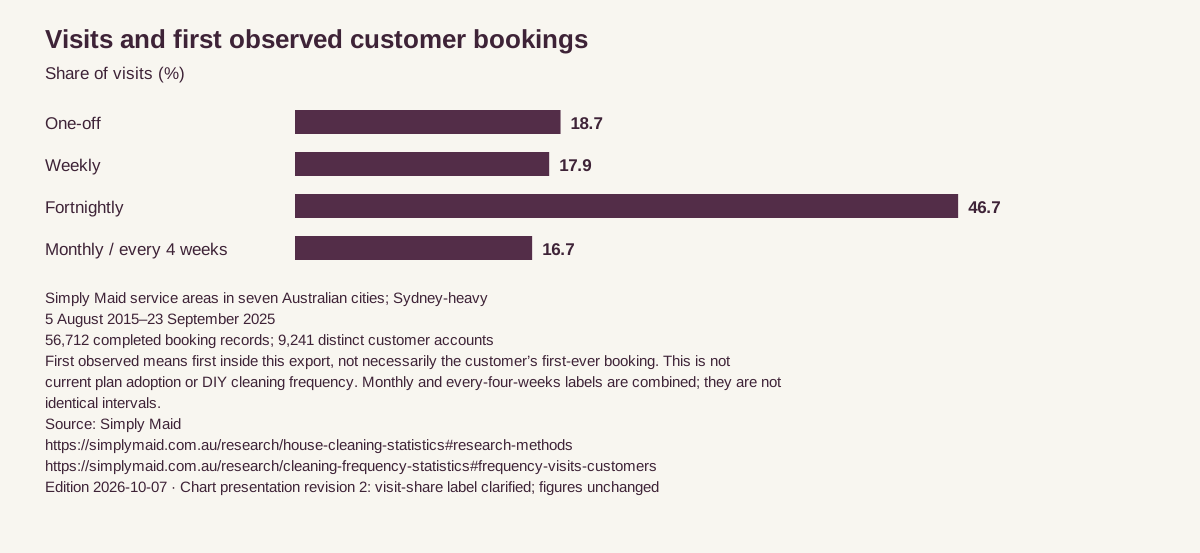
Fortnightly labels account for 46.7% of Simply Maid’s 56,712 historical completed visits, but 16.5% of 9,241 accounts’ first observed completed bookings (5 August 2015–23 September 2025, seven Australian cities).
View supporting tableSimply Maid service areas in seven Australian cities; Sydney-heavy · 5 August 2015–23 September 2025. 56,712 completed booking records; 9,241 distinct customer accounts.
First observed means first inside this export, not necessarily the customer’s first-ever booking. This is not current plan adoption or DIY cleaning frequency. Monthly and every-four-weeks labels are combined; they are not identical intervals.
Original source: Simply Maid — Matched Launch27 export and production booking records. Calculation and limitations.
Visits and first observed customer bookings
| Original booked frequency | Completed visits | Share of visits (%) | Customer accounts at first observed booking | Share of customer accounts (%) |
|---|---|---|---|---|
| One-off | 10,607 | 18.7 | 6,431 | 69.6 |
| Weekly | 10,124 | 17.9 | 466 | 5 |
| Fortnightly | 26,500 | 46.7 | 1,523 | 16.5 |
| Monthly / every 4 weeks | 9,481 | 16.7 | 821 | 8.9 |
Simply Maid service areas in seven Australian cities; Sydney-heavy · 5 August 2015–23 September 2025. 56,712 completed booking records; 9,241 distinct customer accounts.
First observed means first inside this export, not necessarily the customer’s first-ever booking. This is not current plan adoption or DIY cleaning frequency. Monthly and every-four-weeks labels are combined; they are not identical intervals.
Original source: Simply Maid — Matched Launch27 export and production booking records. Calculation and limitations.
How this table was made
- Calculation
- Classify the original export Frequency text, matched by Booking ID. For the customer denominator, take each production customerId’s earliest completed service date, breaking same-day ties by numerical legacy booking ID. Customer shares sum to 100% before rounding.
- Unit and denominator
- Visits and distinct customer accounts. 56,712 completed booking records; 9,241 distinct customer accounts
- Missing fields
- No missing legacy IDs, customer account IDs or service dates in the matched cohort.
- Weighting
- Unweighted records; frequent customers contribute more visits.
- Exclusions
- Historical cohort only; no native-platform bookings mixed in. 6,502 import frequency labels differ from the matched original export, largely because hourly services lost their recurring labels. Original export labels are used here. The former 69.8% recurring / 3.5-to-1 claims are withdrawn.
- Disclosure threshold
- At least 30 visits and 20 distinct customer accounts in each published historical cell; no booking-level or postcode exports.
- Data cutoff
- Historical platform through 23 September 2025; production reconciliation captured 7 October 2026
- Edition
- 2026-10-07
Why the percentages differ
Repeated visits accumulate: a weekly customer has many chances to appear in a visits table. The customer table counts each account once, according to its first observed completed booking in this export. It is not a count of active plans, a retention rate or a claim about the first clean a household ever booked.
One-off labels account for 18.7% of visits but 69.6% of accounts’ first observed bookings. Fortnightly labels account for 46.7% of visits and 16.5% of first observed bookings. The difference illustrates weighting; it does not prove customers changed frequency or explain why they bought the service.
Monthly and every-four-weeks labels are grouped because both occur historically; they should not be treated as the same annual number of visits. A one-off clean can also be followed by another one-off clean. None of these labels measures DIY cleaning between professional visits.
Why this differs from the original report
We matched each export Booking ID to its production legacyBookingId. On 6,502 rows the imported originalFrequencyText differs from the export, largely because the importer’s hourly-service branch returned One Time before parsing frequency. Another 14 ‘Every week’ labels were mapped to one-off by the importer. The study now classifies the matched original labels; it does not change operational bookings or their plans.
The previous 69.8% recurring and 3.5-to-1 fortnightly-to-weekly statements came from that imported mapping. They are withdrawn. Under original labels, 81.3% of historical completed visits carry a recurring label. This is a share of visits, not a share of customers choosing a current plan.
The current platform is a separate cohort with a shorter observation window and different plan machinery. It is not pooled here or presented as a like-for-like trend. Research on current plan choices needs a deduplicated plan cohort and a declared observation window.
Methods, scope and responsibility
This edition counts 56,712 records marked completed in the historical Simply Maid platform, dated 5 August 2015–23 September 2025. These are repeated visits across seven service cities, concentrated in Sydney. They are not a sample of Australian households. 9,241 distinct customer accounts appear; accounts are not independently identified households or homes.
We matched the original Launch27 export to production using Booking ID / legacyBookingId. The export has 56,782 rows; 70 absent from production were excluded. Ascending and descending production scans overlapped by 5,030 rows. We deduplicated by production record ID and checked unique legacy IDs. Customer and calendar grouping have no missing keys in this cohort. Only aggregates are published.
Calendar analysis reads the original local service date (DD/MM/YYYY). It does not apply a UTC offset to that date or equate scheduled starts with recorded arrivals. Historical records do not provide trustworthy measured cleaner time. We publish no duration result from them.
Booking-count tables retain 380 zero-charge visits; they are records marked completed, not verified paid cleans. Refunds do not establish whether a visit took place and are not an exclusion in these historical count tables. No imports have the staff-test flag; an absence of a flag cannot independently rule out all unflagged tests. Each historical result cell must contain at least 30 visits and 20 distinct customer accounts. No address, customer, cleaner, holiday-day or postcode-level result is exported.
The historical and native platforms remain separate. We found no shared legacy booking IDs across them; this does not establish identity for every person using both systems. Pricing’s 56,546 at its 7 October 2026 cutoff equals 56,712 historical records minus 380 zero-charge historical records plus 214 eligible native-platform visits. Pricing additionally filters staff tests, staff customers, future dates, missing service/city data and refunds of at least 90%. It is a different, changing denominator, not a correction of the historical headline.
Historical coverage is sparse after May 2025 and has a late September record; the native-platform cohort starts in April 2026. A gap in these records is not evidence of zero Australian cleaning demand. We do not join the gap into a continuous demand or price trend.
Data owner: Simply Maid. This edition is an AI-assisted editorial reanalysis of company service records. The original report was credited to Huy Hoang, founder; no independent statistical review or new personal reviewer sign-off is asserted. Questions and corrections can use the existing media contact.
Historical data through: 23 September 2025. Production reconciliation and sources checked: 7 October 2026. Edition and article update: 7 October 2026. The initial pillar publication date remains 1 September 2026. Each table has its own calculation, denominator and exclusions. Download the frozen edition.
Corrections
7 October 2026: first separate frequency study. Original export labels replace the importer’s frequency mapping for this historical analysis. See the pillar correction history.
7 October 2026: chart presentation revision 2 explicitly labels the plotted series as share of visits. Figures and the underlying data edition are unchanged. The original dated chart is retained; current download links use the clarified chart.