
Simply Maid research
Average house size in Australia
The average floor area of a newly completed Australian house was 241.5 m² in 2024–25, according to the Australian Bureau of Statistics (ABS). This measures new houses completed that year, not every home in Australia. Explore dwelling types, state comparisons and 15 years of published data below.
A quick reference
Key findings
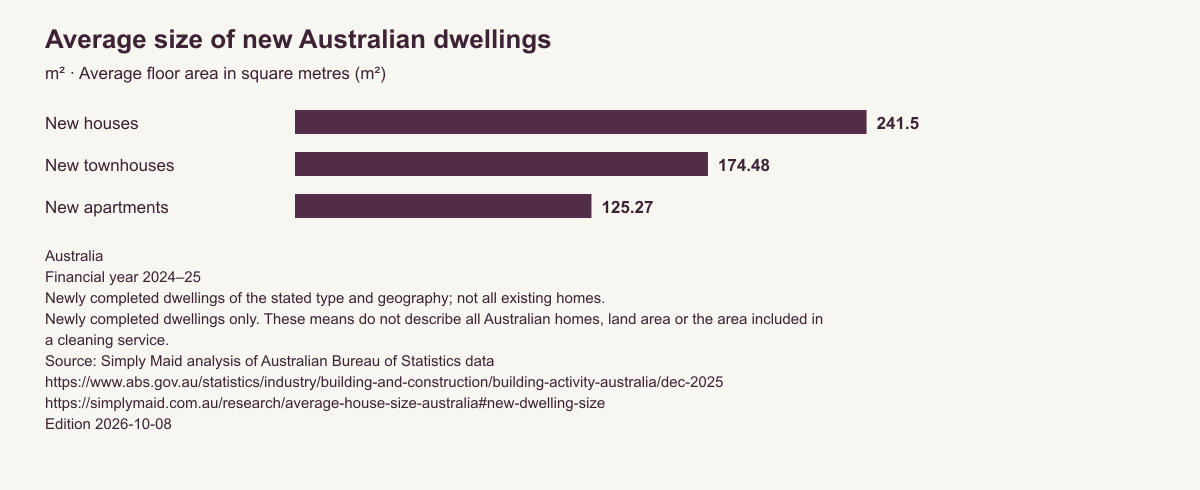
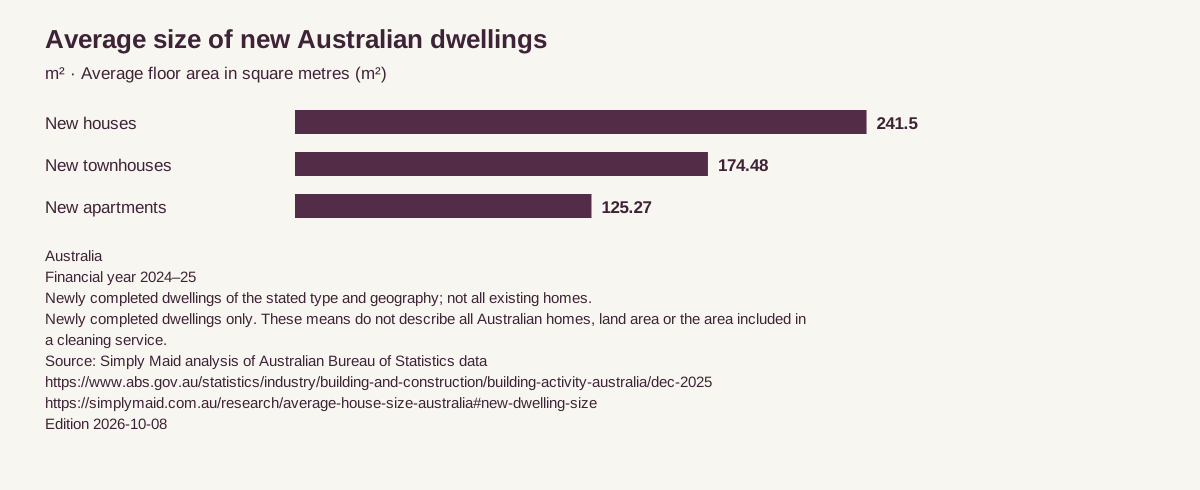
New houses averaged 241.5 m² in Australia in 2024–25; new townhouses averaged 174.48 m² and new apartments 125.27 m² (ABS).
View supporting tableAustralia · Financial year 2024–25. Newly completed dwellings of the stated type and geography; not all existing homes..
Newly completed dwellings only. These means do not describe all Australian homes, land area or the area included in a cleaning service.
Original source: Australian Bureau of Statistics — Building Activity, Australia: Average Floor Area, December 2025 release. Calculation and limitations.
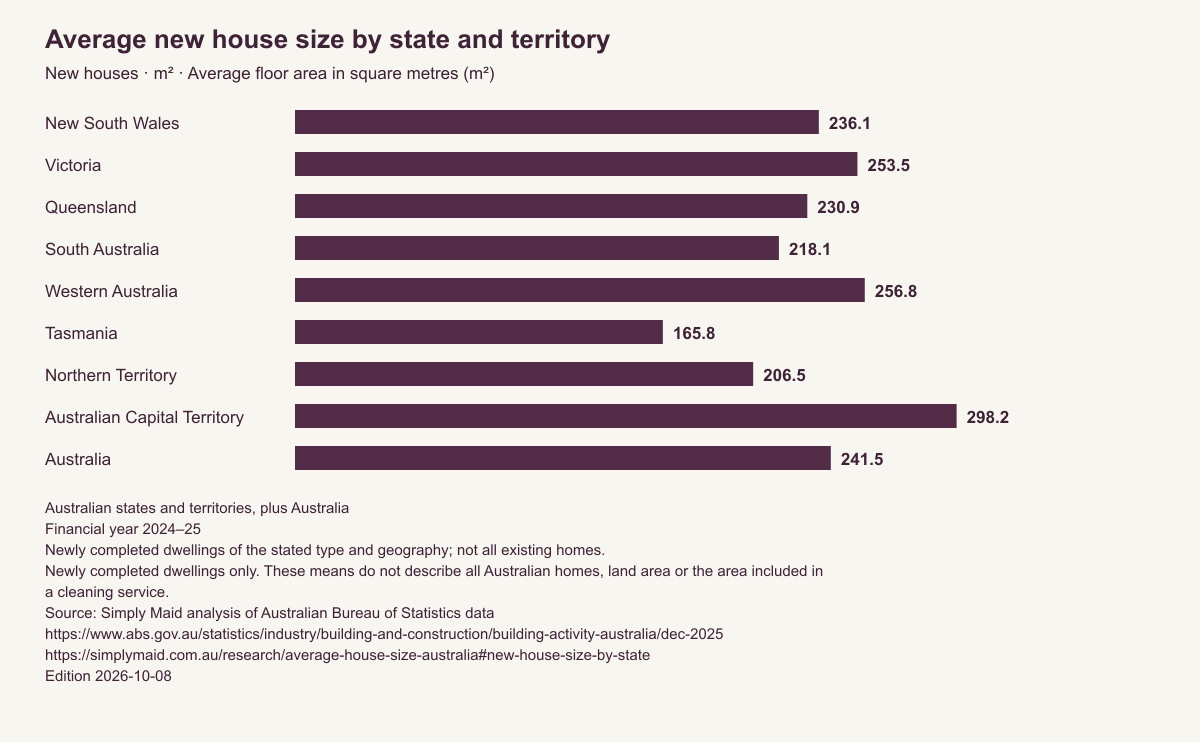
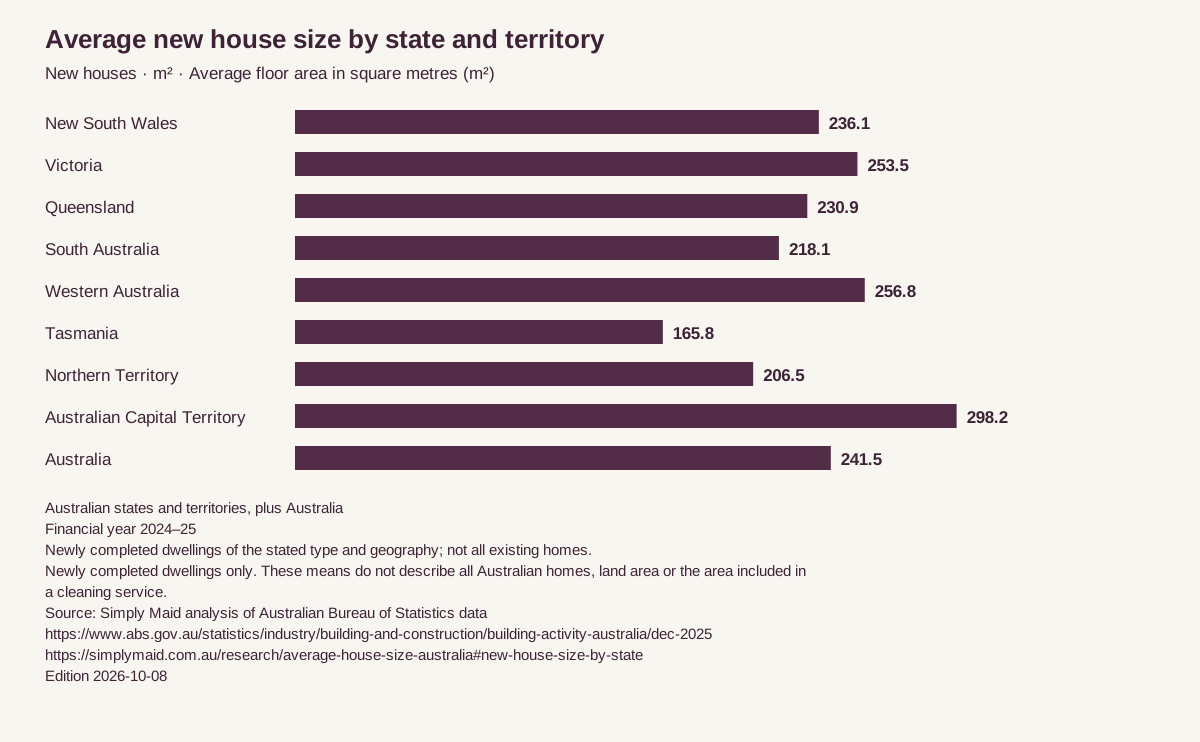
In 2024–25, average new house floor area ranged from 165.8 m² in Tasmania to 298.2 m² in the ACT (ABS); these are jurisdiction averages, not city estimates.
View supporting tableAustralian states and territories, plus Australia · Financial year 2024–25. Newly completed dwellings of the stated type and geography; not all existing homes..
Newly completed dwellings only. These means do not describe all Australian homes, land area or the area included in a cleaning service.
Original source: Australian Bureau of Statistics — Building Activity, Australia: Average Floor Area, December 2025 release. Calculation and limitations.
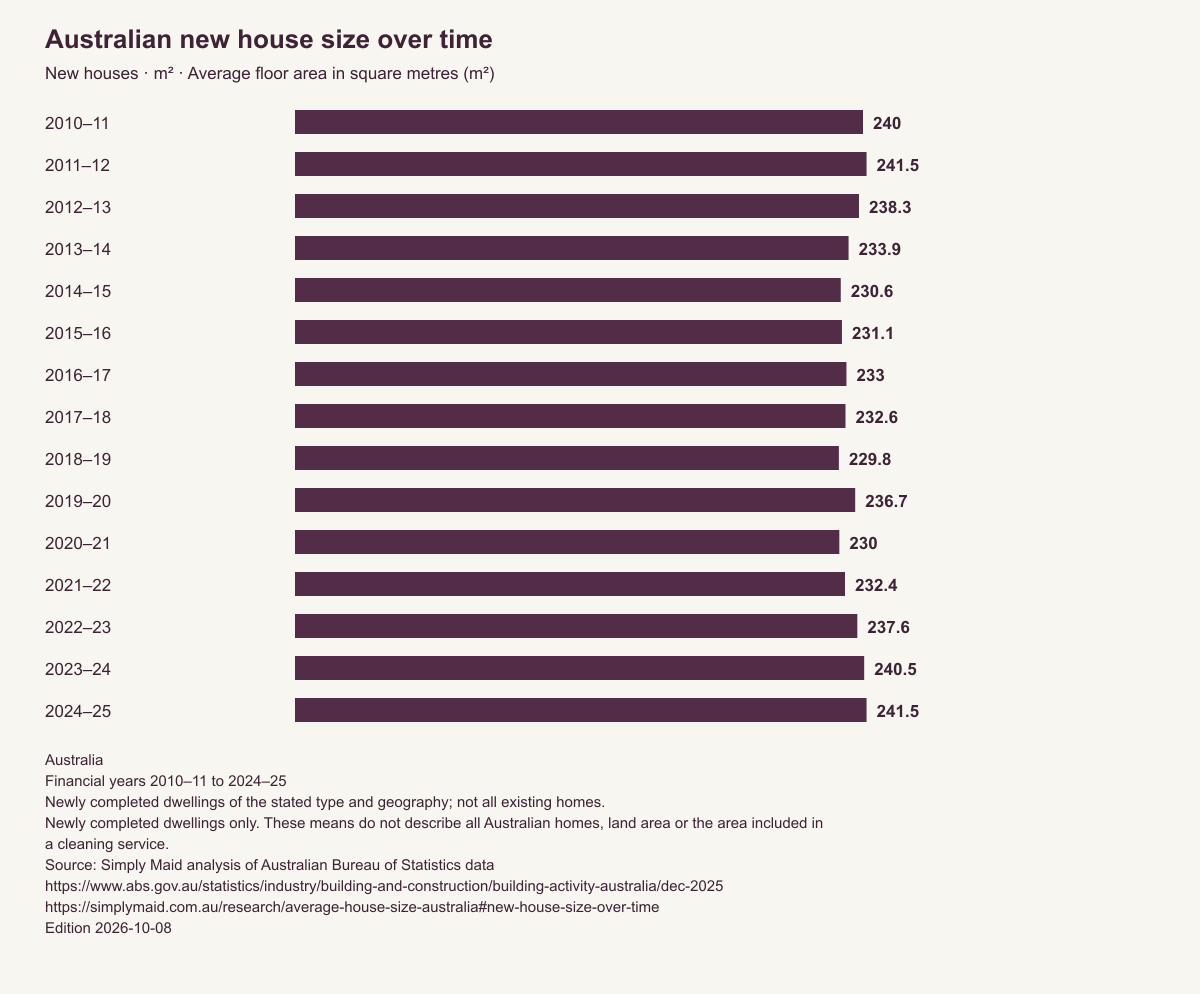
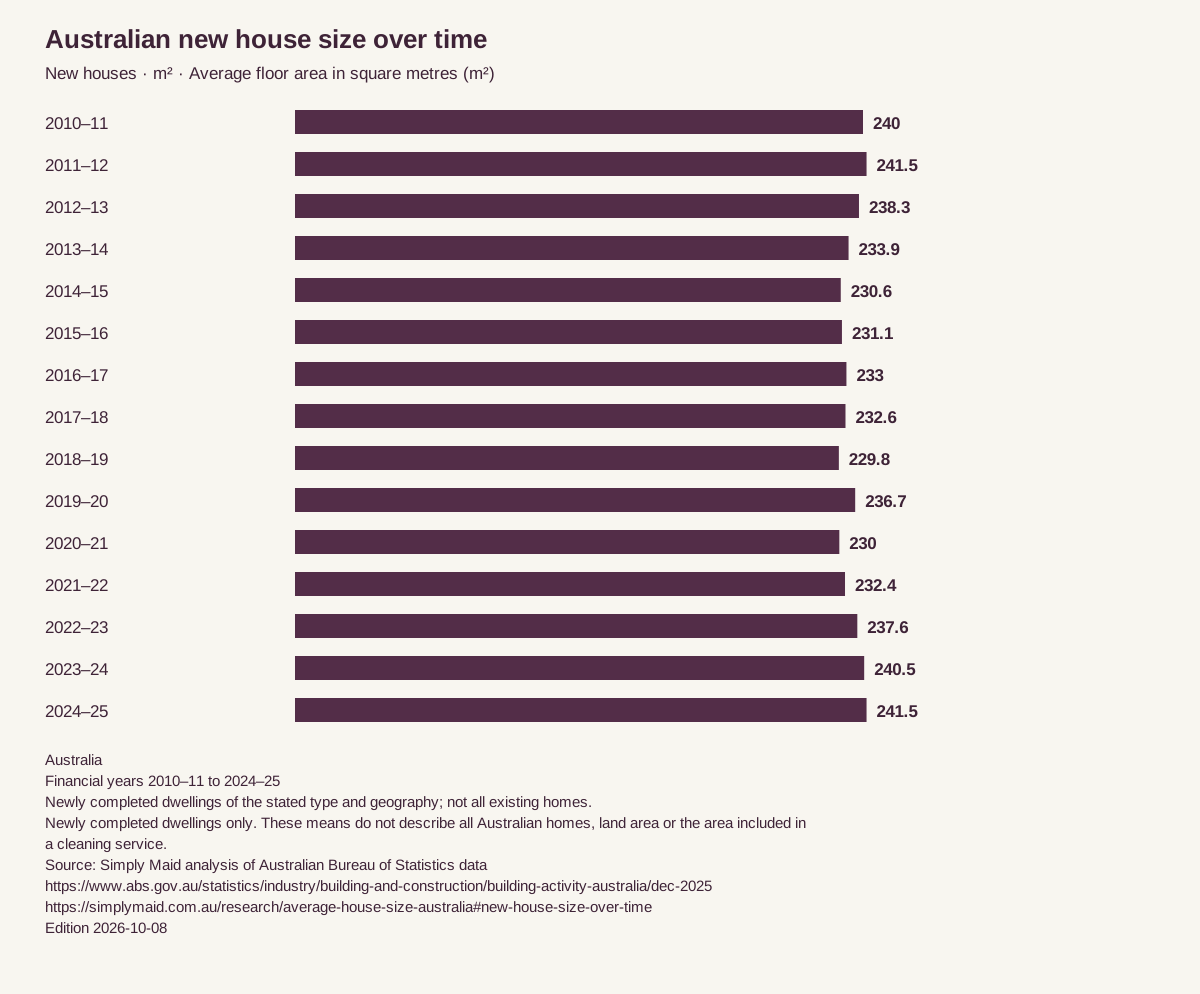
New Australian houses averaged 240.0 m² in 2010–11 and 241.5 m² in 2024–25 (ABS). The annual series fluctuated rather than rising each year.
View supporting tableAustralia · Financial years 2010–11 to 2024–25. Newly completed dwellings of the stated type and geography; not all existing homes..
Newly completed dwellings only. These means do not describe all Australian homes, land area or the area included in a cleaning service.
Original source: Australian Bureau of Statistics — Building Activity, Australia: Average Floor Area, December 2025 release. Calculation and limitations.
Average size of new Australian dwellings
| New dwelling type | Average floor area (m²) |
|---|---|
| New houses | 241.5 |
| New townhouses | 174.48 |
| New apartments | 125.27 |
Australia · Financial year 2024–25. Newly completed dwellings of the stated type and geography; not all existing homes..
Newly completed dwellings only. These means do not describe all Australian homes, land area or the area included in a cleaning service.
Original source: Australian Bureau of Statistics — Building Activity, Australia: Average Floor Area, December 2025 release. Calculation and limitations.
How this table was made
- Calculation
- Transcribed from the ABS Average Floor Area workbook, December 2025 release, published 8 April 2026. Published averages and precision are retained; no microdata calculation or significance test by Simply Maid.
- Unit and denominator
- Average floor area in square metres (m²). Newly completed dwellings of the stated type and geography; not all existing homes.
- Missing fields
- Not published means the geography/type combination is absent from this workbook. It is not zero and is not estimated.
- Weighting
- Published ABS national and jurisdiction averages are used directly. States and dwelling types are not averaged together.
- Exclusions
- Existing housing stock and renovations are outside these new-dwelling series. No city, suburb or bedroom-count estimates are inferred.
- Disclosure threshold
- No additional Simply Maid suppression threshold. Counts and sampling errors are not supplied in this workbook; consult ABS methodology for survey limitations.
- Data cutoff
- Source checked 8 October 2026; latest annual floor-area observation in this workbook is 2024–25.
- Edition
- 2026-10-08
What does average house size measure?
Here, size means floor area in square metres. The ABS workbook reports separate averages for new houses, new townhouses and new apartments. In 2024–25, those national averages were 241.5 m², 174.48 m² and 125.27 m² respectively. We retain the precision published for each series.
These are means for new completions. They do not give the median home size or an average across Australia's existing housing stock. A home built decades ago may differ from this year's new construction. Nor should the three dwelling-type averages be averaged together: their numbers of completions differ.
House size also differs from block or land size, and from household size, which counts people. None of these floor-area figures measures the rooms or surfaces included in a particular cleaning service.
Average new house size by state and territory
| State or territory | New houses (m²) | New townhouses (m²) | New apartments (m²) |
|---|---|---|---|
| New South Wales | 236.1 | 165.75 | 122.6 |
| Victoria | 253.5 | 182.4 | 123.09 |
| Queensland | 230.9 | 167.8 | 141.16 |
| South Australia | 218.1 | 174.94 | Not published |
| Western Australia | 256.8 | 184.94 | Not published |
| Tasmania | 165.8 | 136.99 | Not published |
| Northern Territory | 206.5 | 163.52 | Not published |
| Australian Capital Territory | 298.2 | 179.6 | Not published |
| Australia | 241.5 | 174.48 | 125.27 |
Australian states and territories, plus Australia · Financial year 2024–25. Newly completed dwellings of the stated type and geography; not all existing homes..
Newly completed dwellings only. These means do not describe all Australian homes, land area or the area included in a cleaning service.
Original source: Australian Bureau of Statistics — Building Activity, Australia: Average Floor Area, December 2025 release. Calculation and limitations.
How this table was made
- Calculation
- Transcribed from the ABS Average Floor Area workbook, December 2025 release, published 8 April 2026. Published averages and precision are retained; no microdata calculation or significance test by Simply Maid.
- Unit and denominator
- Average floor area in square metres (m²). Newly completed dwellings of the stated type and geography; not all existing homes.
- Missing fields
- Not published means the geography/type combination is absent from this workbook. It is not zero and is not estimated.
- Weighting
- Published ABS national and jurisdiction averages are used directly. States and dwelling types are not averaged together.
- Exclusions
- Existing housing stock and renovations are outside these new-dwelling series. No city, suburb or bedroom-count estimates are inferred.
- Disclosure threshold
- No additional Simply Maid suppression threshold. Counts and sampling errors are not supplied in this workbook; consult ABS methodology for survey limitations.
- Data cutoff
- Source checked 8 October 2026; latest annual floor-area observation in this workbook is 2024–25.
- Edition
- 2026-10-08
Where are new houses largest?
The ACT had the largest published average for new houses in 2024–25, at 298.2 m². Western Australia followed at 256.8 m² and Victoria at 253.5 m². Tasmania had the smallest, at 165.8 m². These comparisons describe the new houses completed in each jurisdiction during that financial year.
The table also includes new townhouses and apartments where the workbook provides them. Apartment figures are available for NSW, Victoria, Queensland and Australia. The other jurisdictions are marked Not published; missing values are not zero. The chart compares houses only.
A state average is not a capital-city average. The NSW figure cannot answer average house size in Sydney, and the Victorian figure cannot answer average house size in Melbourne. This source does not provide the city or suburb detail needed for those estimates.
Australian new house size over time
| Financial year | New house average floor area (m²) |
|---|---|
| 2010–11 | 240 |
| 2011–12 | 241.5 |
| 2012–13 | 238.3 |
| 2013–14 | 233.9 |
| 2014–15 | 230.6 |
| 2015–16 | 231.1 |
| 2016–17 | 233 |
| 2017–18 | 232.6 |
| 2018–19 | 229.8 |
| 2019–20 | 236.7 |
| 2020–21 | 230 |
| 2021–22 | 232.4 |
| 2022–23 | 237.6 |
| 2023–24 | 240.5 |
| 2024–25 | 241.5 |
Australia · Financial years 2010–11 to 2024–25. Newly completed dwellings of the stated type and geography; not all existing homes..
Newly completed dwellings only. These means do not describe all Australian homes, land area or the area included in a cleaning service.
Original source: Australian Bureau of Statistics — Building Activity, Australia: Average Floor Area, December 2025 release. Calculation and limitations.
How this table was made
- Calculation
- Transcribed from the ABS Average Floor Area workbook, December 2025 release, published 8 April 2026. Published averages and precision are retained; no microdata calculation or significance test by Simply Maid.
- Unit and denominator
- Average floor area in square metres (m²). Newly completed dwellings of the stated type and geography; not all existing homes.
- Missing fields
- Not published means the geography/type combination is absent from this workbook. It is not zero and is not estimated.
- Weighting
- Published ABS national and jurisdiction averages are used directly. States and dwelling types are not averaged together.
- Exclusions
- Existing housing stock and renovations are outside these new-dwelling series. No city, suburb or bedroom-count estimates are inferred.
- Disclosure threshold
- No additional Simply Maid suppression threshold. Counts and sampling errors are not supplied in this workbook; consult ABS methodology for survey limitations.
- Data cutoff
- Source checked 8 October 2026; latest annual floor-area observation in this workbook is 2024–25.
- Edition
- 2026-10-08
Are Australian houses getting bigger?
The answer depends on the period and dwelling type. This ABS series puts the average new house at 240.0 m² in 2010–11 and 241.5 m² in 2024–25. The latest value is above the preceding year's 240.5 m², but the full series moves both up and down.
All 15 observations come from the same December 2025 workbook. We do not splice values from older releases, which may use earlier revisions. These averages alone do not identify why sizes changed or whether a difference is statistically significant. They also do not describe changes in the size of existing homes.
What is the average size of a three- or four-bedroom house?
This workbook does not break floor area down by bedroom count, so it cannot supply a defensible Australian average for a three- or four-bedroom house. A national new-house average should not be presented as an estimate for either.
ABS Census 2021 data describes bedroom counts, dwelling types and tenure in local areas. Those counts do not reveal floor area. Combining a locality's bedroom distribution with this national construction average would not produce a measured local house size.
What does house size tell you about cleaning?
Floor area can help describe a home, but it cannot by itself determine cleaning time or price. Bathrooms, the condition of the home, clutter, surfaces and the tasks requested also affect the work. A national construction average is not a substitute for details about your own property.
For practical planning, start with our guide to hiring a cleaner. For a different question—how much time Australians spend on housework—see our separately sourced housework and domestic labour study.
Sources and method
The source is ABS Building Activity, Australia, December 2025, released 8 April 2026, and its Average Floor Area workbook. The annual floor-area data ends in 2024–25. The June 2026 Building Activity release was also checked on 8 October 2026; a newer quarterly construction release does not itself supply newer annual floor-area observations.
Simply Maid transcribed the published aggregates, retained their numeric precision, selected the latest financial year for comparisons and the full available national new-house series for the trend. The national figures are published ABS values, not unweighted averages of the states. No customer or booking records enter these tables.
Read the ABS survey methodology and reliability notes for coverage, estimation, sampling error and revisions. We do not have the microdata or completion counts behind these workbook averages and have not tested statistical significance. Missing jurisdiction/type combinations are retained as Not published.
Source: Australian Bureau of Statistics, Building Activity, Australia, Average Floor Area. ABS data used with permission from the Australian Bureau of Statistics. Published under Creative Commons Attribution 4.0. This is AI-assisted Simply Maid editorial analysis of ABS data; no independent research review is claimed.
Download and cite the data
Each table has a source-preserving copy control and a CSV download; charts are available as PNG and SVG. The 8 October 2026 frozen edition records the tables, source workbook hash and qualifications. Keep the financial year, new-completions scope and ABS attribution with any reused figure.
Suggested citation: Simply Maid, Average house size in Australia, 8 October 2026 edition, using Australian Bureau of Statistics, Building Activity, Australia, Average Floor Area, December 2025 release. Observation period: 2024–25 for current comparisons; 2010–11 to 2024–25 for the house-size series.
Change log
Who wrote and edited this article, when its sources were checked, and what changed.
Current version
What changed
8 October 2026: First edition published, with national dwelling-type comparisons, state and territory averages and the 15-year national new-house series. Future corrections will be recorded here; published downloads retain their edition date.